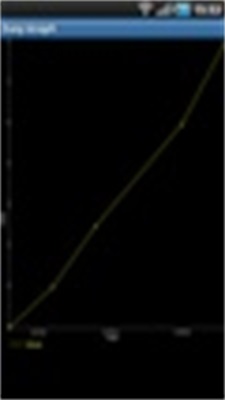
Easy Graph
- Personalization
- 2.4.0
- 1.00M
- by BH Soft
- Android 5.1 or later
- Jan 05,2025
- Package Name: com.bhsoft.graphfree
Tired of wrestling with quantifiable data? Easy Graph simplifies data tracking and management. Perfect for monitoring electricity usage or any metric, this app streamlines the process. Its intuitive interface allows for easy daily data input, which is then transformed into clear visual graphs and charts. Export your data as a text file for further analysis. Easy Graph is an indispensable tool for efficient monitoring and reporting.
Easy Graph Key Features:
- Effortless Data Management: Easily track and manage your quantifiable data sets. Simplifies monitoring metrics like energy consumption.
- Streamlined Data Input: Manage multiple date/value lists effortlessly. The user-friendly interface ensures convenient daily data entry.
- Clear Visualizations: Understand your data with value graphs and growth line charts. Easily interpret trends and monitor progress.
- Data Export: Export datasets as text files for in-depth computer analysis. Ideal for comprehensive reporting.
- Intuitive Design: Efficient data management with a clear, user-friendly graphical display. Perfect for efficient monitoring and reporting.
- Permissions: Requires internet access (primarily for ads) and external storage access (for data export). These are essential for optimal functionality.
In Conclusion:
Easy Graph provides a straightforward solution for anyone needing to monitor their key metrics. Whether personal or professional, this app simplifies data visualization and management. Its ease of use, clear visuals, and data export functionality make it a powerful tool for tracking progress and gaining valuable insights. Download Easy Graph today for hassle-free data management.


Easy Graph用起来真的很方便!数据输入快捷,生成的图表也很清晰,很适合记录每日电费之类的数据。不过如果能加更多模板会更省事 🙌
-
SHAREit: Transfer, Share Files

-
Arena CLOUD

-
Parallel Space - app cloning

-
BAEMIN - Food delivery app

-
Modern House Designs
-
Hardee’s®

-
Xstream Play: Movies & Sports

-
Simple: Weight Loss Coach

-
Faces Video Morph Animator

-
DianaCalling Game

-
SimplyCards - postcards

-
Abu Dhabi Calendar

-
Cincinnati Bengals

-
Miami HEAT Mobile

-
If You Want the Biggest LEGO Pokémon Set, You'd Better Start Saving Now — Leak Suggests It'll Retail for a Whopping $650
It appears one of LEGO’s largest — and most eagerly awaited — Pokémon sets could become one of the company’s priciest ever, with a retail price of around $650. According to LegoLeak on Reddit, the largest set in the upcoming Pokémon line, featuring a
Apr 09,2026 -
Battlefield 6 Matchmaking Factors: SBMM, Ping, Location, Server Availability
Whether this is welcome news may depend on your viewpoint, but it appears Battlefield 6 will incorporate skill-based matchmaking (SBMM) to some extent.EA reportedly confirmed to CharlieIntel during a Battlefield 6 press briefing that the shooter's ma
Apr 09,2026 - ◇ Hatsune Miku Joins Ensemble Stars!! Game Collab Apr 08,2026
- ◇ Toxic Avenger's 'Monster Dong' Scene Hits Theaters Apr 08,2026
- ◇ Albion Online Set to Launch Abyssal Depths Update with New Features Apr 06,2026
- ◇ Xbox Series X|S, One Major Game Releases Ahead Apr 05,2026
- ◇ Civ 7 Update Adds Bermuda Triangle, Everest Apr 02,2026
- ◇ Solve Archaeology Puzzles in Mutropolis' Hand-Drawn World Mar 30,2026
- ◇ Kirkman Teases Diverse Playable Roster for Invincible VS Mar 28,2026
- ◇ inZoi PS5 Release Set for 2024, Xbox Version Under Consideration Mar 27,2026
- ◇ City-Building Game Islanders: New Shores Is Coming to Mobile This Month! Mar 26,2026
- ◇ "Monster Hunter Now Unveils Spring Hunt 2025 Update!" Mar 24,2026
![Roblox Forsaken Characters Tier List [UPDATED] (2025)](https://img.actcv.com/uploads/18/17380116246797f3e8a8a39.jpg)


- 1 Silent Hill 2 Remake Confirms Xbox, Switch Release in 2025 Feb 08,2025
- 2 Fix 'Can't Connect to Host' Error in Ready or Not: Quick Solutions Jun 13,2025
- 3 Connect Asus ROG Ally to TV or Monitor: Easy Guide Apr 06,2025
- 4 Dragon Soul Tier List: Ultimate Guide May 12,2025
- 5 The Best Free Comic Book Sites and Apps in 2025 Mar 18,2025
- 6 "Persona Games and Spin-Offs: Complete Chronological List" Apr 09,2025
- 7 Assassin's Creed Shadows: Max Level and Rank Cap Revealed Mar 27,2025
- 8 How to Run JioHotstar on PC with BlueStacks Feb 28,2025


-
Top Arcade Classics and New Hits
A total of 10
-
Addictive Arcade Games for Mobile
A total of 10
-
Android Apps for Video Content Creation
A total of 10